Overview
Track student progress, identify trends, and measure the effectiveness of your classroom economy with comprehensive analytics and reporting tools.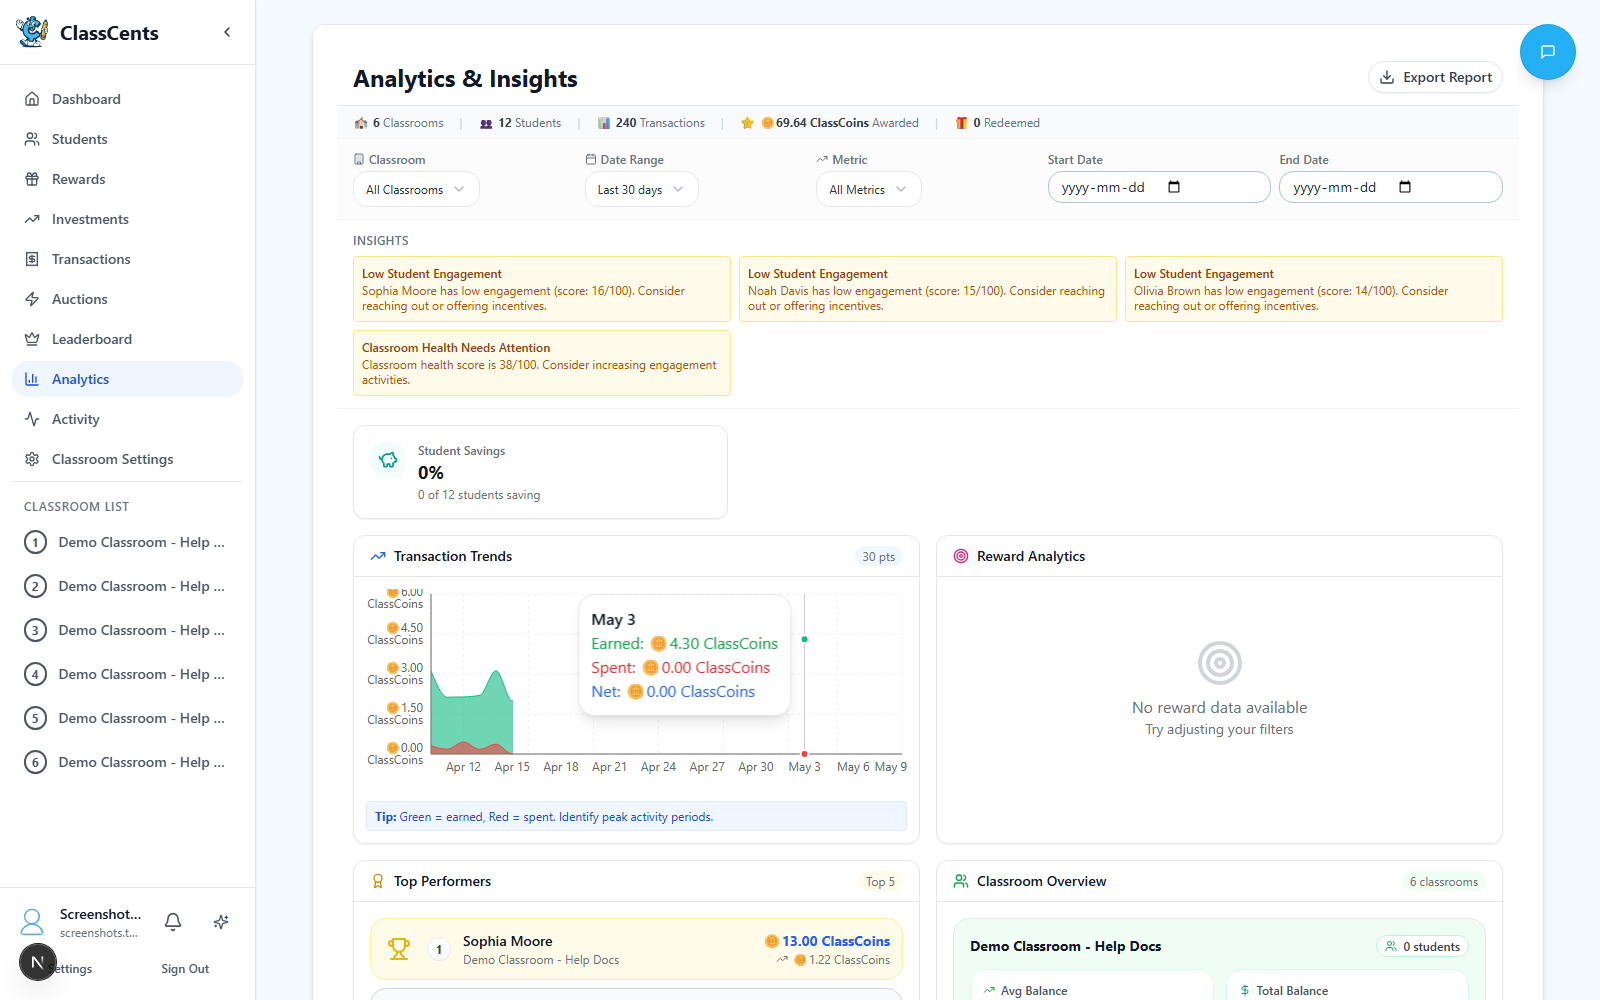
Accessing Analytics
Filter by Classroom
Use the classroom selector at the top to focus on one classroom or view All Classrooms combined.
Review Insights and Charts
The page surfaces auto-generated insight cards (warnings, successes, info) and a series of charts: transaction trends, top earners, reward redemptions, job performance, student engagement, balance distribution, and badge stats.
Key Metrics to Track
Student-Level Metrics
- Current Balance
- Total Earned
- Earning Rate
- Spending Behavior
What it shows: How much currency each student currently hasWhat to look for:
- Students with zero balance may be disengaged
- Very high balances may indicate fear of spending
- Negative balances need immediate attention
Classroom-Level Metrics
- Total Currency Circulation
- Transaction Volume
- Reward Popularity
- Average Balance
What it shows: Sum of all student balancesWhy it matters:
- Too high = inflation risk, adjust earning rates down
- Too low = students feel poor, increase opportunities
- Steady growth = healthy economy
Using Analytics Effectively
Identify Students Needing Support
Identify Students Needing Support
Use analytics to find students who need intervention:Low Balance + Low Earning:
- Not engaged with system
- May need different motivation
- Consider one-on-one conversation
- Create earn opportunities they can succeed at
- Spending impulsively
- May need budgeting lesson
- Help set savings goals
Adjust Pricing Strategy
Adjust Pricing Strategy
Use demand data to optimize prices:Reward never purchased: Price too high or undesirable
Reward always sold out: Price too low or very popular
Some students priced out: Need more low-cost options
Everyone hoarding: Make spending more appealing
Celebrate Successes
Celebrate Successes
Share positive trends:
- “Class earned 5,000 points this week!”
- “Everyone completed homework 10 days straight!”
- “Record number of students reached savings goals!”
Refine Teaching Strategy
Refine Teaching Strategy
Learn from the data:
- Which behaviors earn students the most? Do more of that!
- What times are most active? Schedule important activities then
- Are certain students never earning? Why? How can you help?
- Is the economy too inflated or too restrictive? Adjust!
Timezone for Analytics
Your user profile timezone (set in User Settings) controls how dates and times are displayed in analytics. This is separate from payment timezone!
- Profile Timezone: For viewing analytics data
- Payment Timezone: For when automated payments occur
Export Options
Click Export in the analytics title bar to download your filtered data:- CSV — raw rows for spreadsheets (top earners, student engagement, reward redemptions, job performance, etc.)
- HTML Report — a print-ready summary you can save as PDF or share with admins
Privacy Considerations
Analytics data stays within your account - not shared with other teachers or ClassCents staff
Students only see their own data, never classmates’ balances or activity
Parent reports can be generated per student for communication
Anonymized data may be used for system improvements (opt-in only)
Related Topics
Transaction System
Understand transaction tracking
Student Management
View individual student analytics